Daily Manipulation and Distribution Levels with Buy/Sell SignalsIndicator Summary:
This indicator is designed for intraday traders, highlighting key price levels and providing simple buy/sell signals based on price manipulation and distribution concepts.
Key Features:
Core Levels:
Manipulation Plus/Minus: Derived from the daily open and a portion of the daily range (e.g., 25%).
Distribution Levels: Daily high and low serve as ultimate targets or resistance/support levels.
Buy and Sell Signals:
Buy Signal: Triggered when the price crosses above the Manipulation Plus level. A green "BUY" label marks the entry.
Sell Signal: Triggered when the price crosses below the Manipulation Minus level. A red "SELL" label marks the entry.
Clean Chart Design:
Hides unnecessary clutter, showing only relevant key levels and labeled signals for clarity.
How to Use:
Entry Points:
Buy Entry: When a green "BUY" label appears after the price breaks above the Manipulation Plus level.
Sell Entry: When a red "SELL" label appears after the price breaks below the Manipulation Minus level.
Exit Strategy:
Take Profit: Use the Distribution Levels (daily high/low) as take-profit zones.
Stop Loss: Set just above/below the Manipulation Levels to manage risk effectively.
One to Two Trades per Session: Focus on high-probability moves to ensure clarity and reduce overtrading.
Who It’s For:
This indicator is ideal for traders seeking a structured and visual approach to intraday trading, with clear entry/exit criteria based on price manipulation and distribution theory. It simplifies decision-making and ensures clean chart setups without overwhelming visuals.
Cari dalam skrip untuk "stop loss"
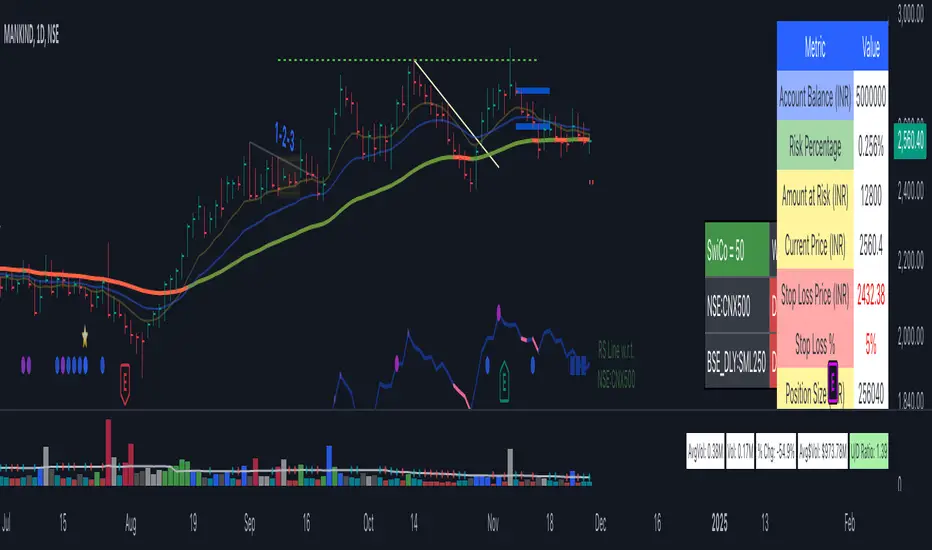
Position Size Calculator by Dr. Rahul Ware.Position Size Calculator
The Position Size Calculator script helps traders determine the optimal position size for their trades based on their account balance, risk percentage, and stop loss parameters. It calculates the number of shares to buy and the total position size in INR (Indian Rupees), providing a clear and concise way to manage risk effectively.
Key Features:
Account Balance Input: Specify your account balance in INR to tailor the position size calculations to your specific trading capital.
Risk Percentage Input: Define the percentage of your account balance you are willing to risk on each trade, ensuring you stay within your risk tolerance.
Stop Loss Options: Choose between using a fixed stop loss price or a stop loss percentage to calculate the risk amount per share.
Dynamic Stop Loss Line: The script plots a red dotted line representing the stop loss price on the chart, updating dynamically for the last bar.
Comprehensive Table Display: View key metrics, including account balance, risk percentage, amount at risk, current price, stop loss price, stop loss percentage, position size in INR, and the number of shares to buy, all in a neatly formatted table.
This tool is designed to enhance your trading strategy by providing precise position sizing, helping you manage risk effectively and make informed trading decisions. Use this script to optimize your trade sizes and improve your overall trading performance.
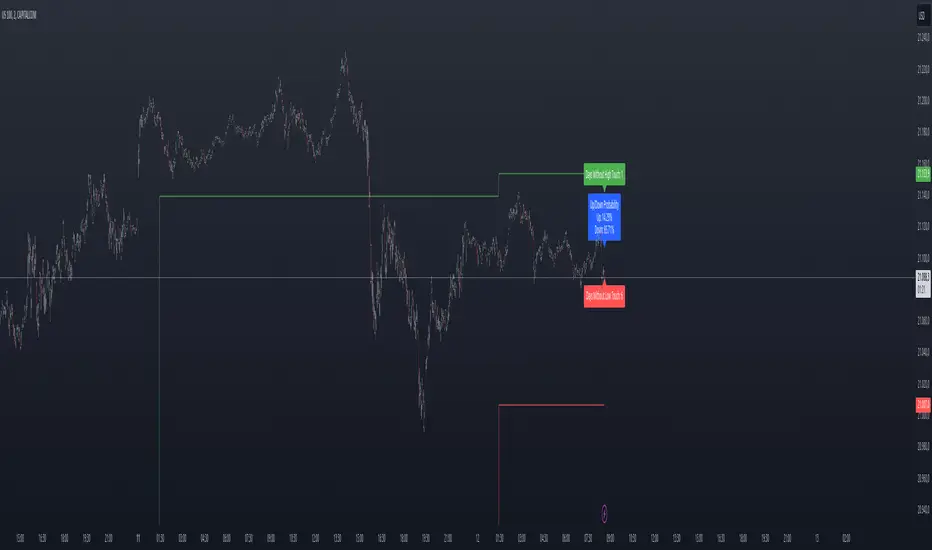
Previous Day High and Low Count with Probabilities
Indicator Explanation
This indicator displays the number of days on which the previous day's high or low prices were not reached and calculates probabilities for future price movements based on this information. It stores the high and low values of the last 45 days and checks daily whether these levels were touched. Based on the number of days without touching either the high or the low, the indicator calculates the probability of future price movements in either direction (Up or Down).
The indicator offers customization options for label placement and color on the chart. The counts for the high and low touches, along with the calculated probabilities (in percentages), are displayed as labels on the chart. These labels can be shifted along the X-axis by up to 50 bars and can be customized in color and size. Additionally, the text for the labels can be freely chosen, giving the user improved flexibility and overview.
In summary, this indicator helps to:
- Track how often previous day's high and low levels were not reached.
- Estimate probabilities for future price movements based on this information.
- Customize the chart display for easier interpretation.
Strategy Concept
Probability and Touch Conditions:
A long position is entered only if:
The probability of reaching the high is at least 60%.
The price has not touched the previous day’s high in the last three days.
Similarly, for short positions:
The probability of reaching the low is at least 60%.
The price has not touched the previous day’s low in the last three days.
Incremental Position Size Increase:
On the 3rd consecutive day without a high/low touch and with the probability condition met, an initial position of 0.01 lots is opened.
On the 4th day, an additional position of 0.01 lots is added.
On the 5th day, an extra position of 0.02 lots is opened.
After a two-day pause, the situation is re-evaluated, and if conditions are still met, a 0.04-lot position is considered.
Trend Reversal Detection:
The strategy also includes a simple trend reversal check. If the market shows clear reversal signals, no new positions will be opened.
Adjustments and Risk Management
This strategy can be adjusted by modifying the probability values, the number of days without a high/low touch, and the lot sizes. Additionally, stop-loss and take-profit levels can be added to further control the risk and secure profits.
Strategy Concept
Probability and Touch Conditions:
A long position is entered only if:
The probability of reaching the high is at least 60%.
The price has not touched the previous day’s high in the last three days.
Similarly, for short positions:
The probability of reaching the low is at least 60%.
The price has not touched the previous day’s low in the last three days.
Incremental Position Size Increase:
On the 3rd consecutive day without a high/low touch and with the probability condition met, an initial position of 0.01 lots is opened.
On the 4th day, an additional position of 0.01 lots is added.
On the 5th day, an extra position of 0.02 lots is opened.
After a two-day pause, the situation is re-evaluated, and if conditions are still met, a 0.04-lot position is considered.
Trend Reversal Detection:
The strategy also includes a simple trend reversal check. If the market shows clear reversal signals, no new positions will be opened.
Risk Disclaimer
The author of this strategy does not assume any liability for potential losses or gains that may arise from the use of this strategy. Trading involves significant risk, and it is important to only trade with capital that you can afford to lose. The strategy presented is for educational purposes only and should not be considered as financial advice. Always conduct your own research and consider seeking advice from a professional financial advisor before making any trading decisions.
ORB with ATR Trailing SL [Bluechip Algos]This is a simple ORB (Opening Range Breakout) Indicator that not only signals breakout directions based on the opening session range but also includes trailing stop levels to manage ongoing trades. Instead of regular fixed Stop loss, we use ATR indicator (ATR based SL) to trail the stop loss that might help in maximizing the profitable trades. This helps especially during the trending days where market moves unidirectionally.
About the Indicator
Opening Range Identification: The indicator defines an initial session timeframe and captures the highest and lowest prices during this period.
Breakout Signals: It signals potential entry points when the price crosses these range boundaries.
Trailing Stop Calculation: Customizable trailing stop-loss based on ATR percentage, helping users lock in profits.
Features
Session Customization: User-defined session for setting the opening range.
Entry Signal Customization: Allows configuration for breakouts on either a closing basis or upon touching the level.
Automatic Stop-Loss Adjustments: Dynamic trailing stop levels that adapt to both long and short entries.
Visual Display: Highlights breakout levels and plots lines representing stop-loss levels.
Understanding the Indicator
Range Calculation: After defining the session, the high and low of the session are locked. The high serves as the upper breakout boundary, and the low as the lower boundary.
Signals (Buy and Sell): The indicator uses crossover conditions:
Buy Signal ("B") when price crosses above the ORB high.
Sell Signal ("S") when price crosses below the ORB low.
Trail Stop Calculation: When a signal is triggered, a trailing stop level is set and updates as the trade progresses:
Long positions have a stop-loss based on a percentage below the last closing price.
Short positions have a stop-loss based on a percentage above the last closing price.
Input Parameters
Session Time (ORB Session Time): Start and end times for setting the ORB range.
Signal Configuration: Choice between "CLOSE" (signal on close) or "TOUCH" (signal as soon as level is touched).
ATR Percentage: Sets the percentage for the trailing stop calculation.
The Pattern-Synced Moving Average System (PSMA)Description:
The Pattern-Synced Moving Average System (PSMA) is a comprehensive trading indicator that combines the reliability of moving averages with automated candlestick pattern detection, real-time alerts, and dynamic risk management to enhance both trend-following and reversal strategies. The PSMA system integrates key elements of trend analysis and pattern recognition to provide users with configurable entry, stop-loss, and take-profit levels. It is designed for all levels of traders who seek to trade in alignment with market context, using signals from trend direction and established candlestick patterns.
Key Functional Components:
Multi-Type Moving Average:
Provides flexibility with multiple moving average options: SMA, EMA, WMA, and SMMA.
The selected moving average helps users determine market trend direction, with price positions relative to the MA acting as a trend confirmation.
Automatic Candlestick Pattern Detection:
Identifies pivotal patterns, including bullish/bearish engulfing and reversal signals.
Helps traders spot potential market turning points and adjust their strategies accordingly.
Configurable Entry, Stop-Loss, and Take-Profit:
Risk management is customizable through risk/reward ratios and risk tolerance settings.
Entry, stop-loss, and take-profit levels are automatically plotted when patterns appear, facilitating rapid trade decision-making with predefined exit points.
Higher Timeframe Trend Confirmation:
Optional feature to verify trend alignment on a higher timeframe (e.g., checking a daily trend on an intraday chart).
This added filter improves signal reliability by focusing on patterns aligned with the broader market trend.
Real-Time Alerts:
Alerts can be set for key pattern detections, allowing traders to respond promptly without constant chart monitoring.
How to Use PSMA:
Set Moving Average Preferences:
Choose the preferred moving average type and length based on your trading strategy. The MA acts as a foundational trend indicator, with price positions indicating potential uptrends (price above MA) or downtrends (price below MA).
Adjust Risk Management Settings:
Set a Risk/Reward Ratio for defining take-profit levels relative to the entry and stop-loss levels.
Modify the Risk Tolerance Percentage to adjust stop-loss placement, adding flexibility in managing trades based on market volatility.
Activate Higher Timeframe Confirmation (Optional):
Enable higher timeframe trend confirmation to filter out counter-trend trades, ensuring that detected patterns are in sync with the larger market trend.
Review Alerts and Trade Levels:
With PSMA’s real-time alerts, traders receive notifications for detected patterns without having to continuously monitor charts.
Visualized entry, stop-loss, and take-profit lines simplify trade execution by highlighting levels directly on the chart.
Execute Based on Entry and Exit Levels:
The entry line suggests the potential entry price once a bullish or bearish pattern is detected.
The stop-loss line is based on your set risk tolerance, establishing a predefined risk level.
The take-profit line is calculated according to your preferred risk/reward ratio, providing a clear profit target.
Example Strategy:
Ensure price is above or below the selected moving average to confirm trend direction.
Await a PSMA signal for a bullish or bearish pattern.
Review the plotted entry, stop-loss, and take-profit lines, and enter the trade if the setup aligns with your risk/reward criteria.
Activate alerts for continuous monitoring, allowing PSMA to notify you of emerging trade opportunities.
Release Notes:
Line Color and Style Customization: Customizable colors and line styles for entry, stop-loss, and take-profit levels.
Dynamic Trade Tracking: Tracks trade statistics, including total trades, win rate, and average P/L, displayed in the data window for comprehensive trade performance analysis.
Summary: The PSMA indicator is a powerful, user-friendly tool that combines trend detection, pattern recognition, and risk management into a cohesive system for improved trade decision-making. Suitable for stocks, forex, and futures, PSMA offers a unique blend of adaptability and precision, making it valuable for day traders and long-term investors alike. Enjoy this tool as it enhances your ability to execute timely, well-informed trades on TradingView.
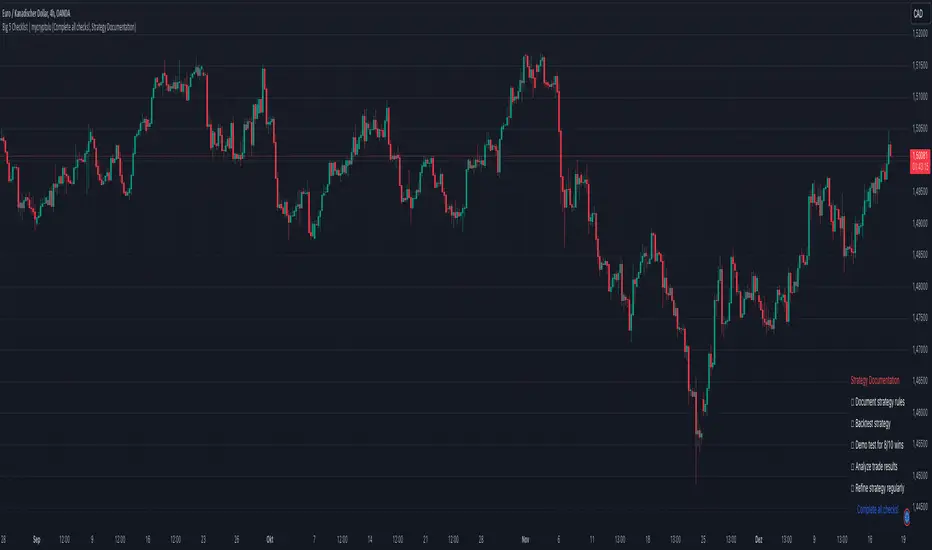
Big 5 Checklist | XEONEDIAThe Big 5 Checklist | XEONEDIA indicator is a powerful trading tool designed to help traders prepare their trading decisions in a structured and effective manner. The indicator encompasses five key areas:
Strategy Documentation :
✅ Ensure that the trading strategy is clearly defined and documented.
✅ Conduct backtesting.
✅ Perform demo testing with an 80% success rate.
✅ Analyze trading results.
✅ Regularly refine the strategy.
Risk Management :
✅ Minimize financial losses and ensure responsible trading.
✅ Set a risk limit of 1-2%.
✅ Use stop-loss orders.
✅ Ensure a risk-reward ratio of at least 2:1.
✅ Adjust position sizes.
Technical Analysis :
✅ Evaluate charts and indicators to identify trading opportunities.
✅ Identify support and resistance levels.
✅ Use technical indicators (e.g., RSI).
✅ Set entry and exit points.
✅ Establish alerts for specific market conditions.
Market Conditions :
✅ Consider external factors that may influence trading.
✅ Monitor the economic calendar.
✅ Apply fundamental analysis.
✅ Observe market volatility.
✅ Analyze global trends.
Psychological Management :
✅ Control emotions and mindset during trading.
✅ Adhere to the trading plan.
✅ Manage emotions while trading.
✅ Set realistic expectations.
✅ Take regular mental breaks.
Mastercheck
The Mastercheck provides a digital checklist where traders can track their progress live. Users can make their own notes and view their checklist on any TradingView device, ensuring they stay informed about their trading readiness and can make adjustments in real-time. ✅
Overall, the Big 5 Checklist | XEONEDIA indicator helps minimize risks and maximize the chances of successful trades by promoting systematic and comprehensive trading preparation.
Cumulative Volume Delta Divergence [TradingFinder] Periodic EMA🔵 Introduction
The Cumulative Volume Delta (CVD) is a powerful tool in technical analysis that is derived from market volume or trading activity. The Cumulative Volume Delta Divergence Detector Indicator helps traders identify Cumulative Volume Delta Divergences (CVD Divergence), which can provide reliable trading signals.
These divergences, such as bullish and bearish CVD divergences, act as key indicators of potential trend reversals in financial markets. By analyzing CVD divergences, traders can gain insights into the strength of buying and selling pressure and make more informed predictions about price trends.
The CVD indicator is particularly effective for traders who engage in day trading and scalping, as it helps identify price reversal points by analyzing volume and price behavior.
Using the CVD indicator in combination with other technical tools such as support and resistance levels and candlestick patterns allows for a more accurate market analysis.
🔵 How to Use
Divergences are one of the most important technical analysis signals that indicate the current strength of a price move may not be sustainable.
Cumulative Volume Delta Divergence helps traders identify potential trading opportunities that may not be visible on the price chart alone.
This type of divergence examines the relationship between buying and selling volume and price, enabling traders to better understand price trends.
🟣 Bullish CVD Divergence
A bullish CVD divergence occurs when the price makes a lower low, but the CVD indicator shows a higher low. This indicates increasing buying pressure in the market, even though the price is declining. In other words, despite the price dropping, buyers are gradually gaining strength, which could signal a price reversal and the start of a bullish trend.
How to use this signal : In this scenario, traders looking to go long can use this signal as a favorable opportunity to enter the market. After a bullish divergence, the market typically tends to move upward.
To reduce risk, traders can wait for further confirmation from the price chart. For example, if the price breaks through the previous high after the divergence or breaks a resistance level, this could be a more reliable signal for entering the market.
🟣 Bearish CVD Divergence
A bearish CVD divergence is the opposite of a bullish divergence. In this type of divergence, the price makes a higher high, but the CVD indicator shows a lower high. This indicates decreasing buying pressure and weakening momentum in the current bullish trend. A bearish divergence often serves as a warning of a potential market reversal to the downside.
How to use this signal : Traders can use this divergence as an opportunity to exit long positions or enter short positions. When the CVD indicator makes a lower high compared to the price, it signals weakness in buyer strength.
If traders receive further confirmation from the price chart, such as a break of key support levels or an increase in selling volume, this can serve as a stronger signal for the beginning of a bearish trend.
🟣 How to Build a Trading Strategy with Cumulative Volume Delta Divergence
Using CVD divergence alone may not be sufficient. Traders should combine this tool with other technical analysis techniques and indicators to have more confidence in their decisions. For example, when observing a CVD divergence, traders can also analyze volume, trend lines, or candlestick patterns to get a more accurate market analysis.
Additionally, risk management should always be a priority. Using stop-loss orders and properly sizing trades can help traders minimize their losses if they make a mistake.
🔵 Setting
Divergence Fractal Period : Determines the period of swings. The minimum and default value is 2.
CVD Period : You can set the period of " Periodic " and " EMA " modes.
Cumulative Mode : It has three modes "Periodic" and "EMA". In "Periodic" mode, it accumulates the volume periodically and in "EMA" mode, it calculates the moving average of the volume.
Market Ultra Data : If you turn on this feature, 26 large brokers will be included in the calculation of the trading volume. The advantage of this capability is to have more reliable volume data. You should be careful to specify the market you are in, FOREX brokers and Crypto brokers are different.
🔵 Conclusion
The Cumulative Volume Delta (CVD) indicator is a powerful tool in technical analysis, helping traders better identify price trends and make more accurate market predictions. By identifying CVD divergences, traders can anticipate price reversals and time their market entries and exits accordingly.
Bullish and bearish CVD divergences each provide valuable signals that can help traders identify the best entry and exit points in the market. A bullish CVD divergence signals strength in buying that will likely lead to a price increase, while a bearish CVD divergence indicates weakness in the bullish trend and the potential for the beginning of a bearish trend.
Overall, combining CVD with other technical analysis tools and employing risk management strategies can help traders make better trading decisions and capitalize on available market opportunities.

D-Shape Breakout Signals [LuxAlgo]The D-Shape Breakout Signals indicator uses a unique and novel technique to provide support/resistance curves, a trailing stop loss line, and visual breakout signals from semi-circular shapes.
🔶 USAGE
D-shape is a new concept where the distance between two Swing points is used to create a semi-circle/arc, where the width is expressed as a user-defined percentage of the radius. The resulting arc can be used as a potential support/resistance as well as a source of breakouts.
Users can adjust this percentage (width of the D-shape) in the settings ( "D-Width" ), which will influence breakouts and the Stop-Loss line.
🔹 Breakouts of D-Shape
The arc of this D-shape is used for detecting breakout signals between the price and the curve. Only one breakout per D-shape can occur.
A breakout is highlighted with a colored dot, signifying its location, with a green dot being used when the top part of the arc is exceeded, and red when the bottom part of the arc is surpassed.
When the price reaches the right side of the arc without breaking the arc top/bottom, a blue-colored dot is highlighted, signaling a "Neutral Breakout".
🔹 Trailing Stop-Loss Line
The script includes a Trailing Stop-Loss line (TSL), which is only updated when a breakout of the D-Shape occurs. The TSL will return the midline of the D-Shape subject to a breakout.
The TSL can be used as a stop-loss or entry-level but can also act as a potential support/resistance level or trend visualization.
🔶 DETAILS
A D-shape will initially be colored green when a Swing Low is followed by a Swing High, and red when a Swing Low is followed by a Swing High.
A breakout of the upper side of the D-shape will always update the color to green or to red when the breakout occurs in the lower part. A Neutral Breakout will result in a blue-colored D-shape. The transparency is lowered in the event of a breakout.
In the event of a D-shape breakout, the shape will be removed when the total number of visible D-Shapes exceeds the user set "Minimum Patterns" setting. Any D-shape whose boundaries have not been exceeded (and therefore still active) will remain visible.
🔹 Trailing Stop-Loss Line
Only when a breakout occurs will the midline of the D-shape closest to the closing price potentially become the new Trailing Stop value.
The script will only consider middle lines below the closing price on an upward breakout or middle lines above the closing price when it concerns a downward breakout.
In an uptrend, with an already available green TSL, the potential new Stop-Loss value must be higher than the previous TSL value; while in a downtrend, the new TSL value must be lower.
The Stop-Loss line won't be updated when a "Neutral Breakout" occurs.
🔶 SETTINGS
Swing Length: Period used for the swing detection, with higher values returning longer-term Swing Levels.
🔹 D-Patterns
Minimum Patterns: Minimum amount of visible D-Shape patterns.
D-Width: Width of the D-Shape as a percentage of the distance between both Swing Points.
Included Swings: Include "Swing High" (followed by a Swing Low), "Swing Low" (followed by a Swing High), or "Both"
Style Historical Patterns: Show the "Arc", "Midline" or "Both" of historical patterns.
🔹 Style
Label Size/Colors
Connecting Swing Level: Shows a line connecting the first Swing Point.
Color Fill: colorfill of Trailing Stop-Loss

Breaker Blocks + Order Blocks confirm [TradingFinder] BBOB Alert🔵 Introduction
In the realm of technical analysis, various tools and concepts are employed to identify key levels on price charts. These tools assist traders in analyzing market trends with greater precision, enabling them to optimize their trading decisions. Among these tools, the Order Block and Breaker Block hold a significant place, serving as effective instruments for analyzing market structure.
🟣 Order Block
An Order Block refers to zones on a chart where large financial institutions and high-volume traders place their orders. Due to the substantial volume of buy or sell orders in these areas, they are often regarded as pivotal points for potential price reversals or temporary pauses in a trend. Order Blocks are particularly crucial when prices react to these zones after a strong market move, acting as strong support or resistance levels.
🟣 Breaker Block
On the other hand, a Breaker Block refers to areas on a chart that previously functioned as Order Blocks but where the price has managed to break through and continue in the opposite direction. These zones are typically recognized as key points where market trends might shift, helping traders identify potential reversal points in the market.
🟣 Overlapping Block (BBOB)
Now, imagine a scenario where these two essential concepts in technical analysis—Order Blocks and Breaker Blocks—overlap on a chart. Although this overlap is not specifically discussed within the ICT (Inner Circle Trader) trading framework, exploring and utilizing this overlap can provide traders with powerful insights into strong support and resistance zones. The combination of these two robust concepts can highlight critical areas in trading, potentially offering significant advantages in making informed trading decisions.
In this article, we will delve into the concept of this overlap, explaining how to utilize it in trading strategies. Additionally, we will analyze the potential outcomes and benefits of incorporating this concept into your trading decisions.
Bullish Overlapping Block (BBOB) :
Bearish Overlapping Block (BBOB) :
🔵 How to Use
The overlap between Order Blocks and Breaker Blocks is a compelling and powerful concept that can help traders identify key levels on the chart with a high probability of success. This overlap is particularly valuable because it combines two well-regarded concepts in technical analysis—zones of high order volume and critical market shifts.
🟣 Here’s how to effectively use this overlap in your trading
1. Dentifying the Overlapping Block : To make the most of the overlap between Order Blocks and Breaker Blocks, begin by identifying these zones separately. Order Blocks are areas where price typically reacts and reverses after a strong market move.
Breaker Blocks are areas where a previous Order Block has been breached, and the price continues in the opposite direction. When these two zones overlap on a chart, it’s crucial to pay close attention to this area, as it represents a high-probability reaction zone.
2. Analyzing the Overlapping Block : After identifying the overlap zone, carefully analyze price action within this region. Candlestick patterns and price behavior can provide essential clues.
If the price reaches this overlap zone and strong reversal patterns such as Pin Bars or Engulfing patterns are observed, it’s likely that this zone will act as a pivotal reversal point. In such cases, entering a trade with confidence becomes more feasible.
3. Entering the Trade : When sufficient signs of price reaction are present in the overlap zone, you can proceed to enter the trade. If the overlap zone is within an uptrend and bullish reversal signals are evident, a long position might be appropriate.
Conversely, if the overlap zone is in a downtrend and bearish reversal signals are observed, a short position would be more suitable.
4. Risk Management : One of the most critical aspects of trading in overlap zones is managing risk. To protect your capital, place your stop loss near the lowest point of the Order Block (for buy trades) or the highest point (for sell trades). This approach minimizes potential losses if the overlap zone fails to hold.
5. Price Targets : After entering the trade, set your price targets based on other key levels on the chart. These targets could include other support and resistance zones, Fibonacci levels, or pivot points.
Bullish Overlapping Block :
Bearish Overlapping Block :
🟣 Benefits of the Overlapping Block Between Order Block and Breaker Block
1. Enhanced Precision in Identifying Key Levels : The overlap between these two zones usually acts as a highly reliable area for price reactions, increasing the accuracy of identifying entry and exit points.
2. Reduced Trading Risk : Given the high importance of the overlap zone, the likelihood of making incorrect decisions is reduced, contributing to overall lower trading risk.
3. Increased Probability of Success : The overlap between Order Blocks and Breaker Blocks combines two powerful concepts, enhancing the likelihood of success in trades, as multiple indicators confirm the importance of the area.
4. Creation of Better Trading Opportunities : Overlap zones often provide traders with more robust trading opportunities, as these areas typically represent strong reversal points in the market.
5. Compatibility with Other Technical Tools : This concept seamlessly integrates with other technical analysis tools such as Fibonacci retracements, trend lines, and chart patterns, offering a more comprehensive market analysis.
🔵 Setting
🟣 Global Setting
Pivot Period of Order Blocks Detector : Enter the desired pivot period to identify the Order Block.
Order Block Validity Period (Bar) : You can specify the maximum time the Order Block remains valid based on the number of candles from the origin.
Mitigation Level Order Block : Determining the basic level of a Order Block. When the price hits the basic level, the Order Block due to mitigation.
Mitigation Level Breaker Block : Determining the basic level of a Breaker Block. When the price hits the basic level, the Breaker Block due to mitigation.
Mitigation Level Overlapping Block : Determining the basic level of a Overlapping Block. When the price hits the basic level, the Overlapping Block due to mitigation.
🟣 Overlapping Block Display
Show All Overlapping Block : If it is turned off, only the last Order Block will be displayed.
Demand Overlapping Block : Show or not show and specify color.
Supply Overlapping Block : Show or not show and specify color.
🟣 Order Block Display
Show All Order Block : If it is turned off, only the last Order Block will be displayed.
Demand Main Order Block : Show or not show and specify color.
Demand Sub (Propulsion & BoS Origin) Order Block : Show or not show and specify color.
Supply Main Order Block : Show or not show and specify color.
Supply Sub (Propulsion & BoS Origin) Order Block : Show or not show and specify color.
🟣 Breaker Block Display
Show All Breaker Block : If it is turned off, only the last Breaker Block will be displayed.
Demand Main Breaker Block : Show or not show and specify color.
Demand Sub (Propulsion & BoS Origin) Breaker Block : Show or not show and specify color.
Supply Main Breaker Block : Show or not show and specify color.
Supply Sub (Propulsion & BoS Origin) Breaker Block : Show or not show and specify color.
🟣 Order Block Refinement
Refine Order Blocks : Enable or disable the refinement feature. Mode selection.
🟣 Alert
Alert Name : The name of the alert you receive.
Alert Overlapping Block Mitigation :
On / Off
Message Frequency :
This string parameter defines the announcement frequency. Choices include: "All" (activates the alert every time the function is called), "Once Per Bar" (activates the alert only on the first call within the bar), and "Once Per Bar Close" (the alert is activated only by a call at the last script execution of the real-time bar upon closing). The default setting is "Once per Bar".
Show Alert Time by Time Zone :
The date, hour, and minute you receive in alert messages can be based on any time zone you choose. For example, if you want New York time, you should enter "UTC-4". This input is set to the time zone "UTC" by default.
🔵 Conclusion
The overlap between Order Blocks and Breaker Blocks represents a critical and powerful area in technical analysis that can serve as an effective tool for determining entry and exit points in trading.
These zones, due to the combination of two key concepts in technical analysis, hold significant importance and can help traders make more confident trading decisions.
Although this concept is not specifically discussed in the ICT framework and is introduced as a new idea, traders can achieve better results in their trades through practice and testing.
Utilizing the overlap between Order Blocks and Breaker Blocks, in conjunction with other technical analysis tools, can significantly improve the chances of success in trading.

Chieu - Bollinger Bands SMA 50 StrategyOverview
The Custom Bollinger Bands Indicator is a versatile tool designed to help traders identify potential market reversals and optimize their trading strategies. This indicator combines Bollinger Bands with an ATR-based stop-loss mechanism, configurable take-profit levels, and dynamic position sizing to manage risk effectively. By highlighting key market conditions and providing clear visual cues, it enables traders to make informed decisions and execute trades with precision.
Key Features
Bollinger Bands Calculation:
The indicator calculates Bollinger Bands based on a configurable Simple Moving Average (SMA) length.
Standard deviation multiplier is adjustable, allowing traders to fine-tune the width of the bands.
Candlestick Highlighting:
Candles that touch the upper or lower Bollinger Bands are highlighted, indicating potential overbought or oversold conditions.
Reversal candles are identified and highlighted based on specific criteria:
The candle must touch the Bollinger Bands for two consecutive periods.
The reversal candle must have a body at least twice the size of the previous candle's body.
The reversal candle must close in the opposite direction to the previous candle (e.g., a bullish candle following a bearish one).
Stop-Loss and Take-Profit Levels:
Stop-loss levels are calculated using the ATR (Average True Range) indicator, ensuring they are dynamically adjusted based on market volatility.
Two configurable take-profit levels (1R and 2R) are plotted based on the initial risk (distance between entry and stop-loss).
Take-profit and stop-loss lines are visually represented on the chart for easy reference.
Position Sizing and Risk Management:
The indicator includes configurable inputs for account balance, leverage, and risk percentage.
It calculates the nominal value (position size without leverage) and cost value (position size with leverage) based on the specified risk parameters.
Combined labels display SL, TP, nominal value, and cost value, replacing the default "Reversal" text for clear, concise information.
Customization Options:
Users can configure the length of the take-profit lines.
The option to toggle the highlighting of candles touching the Bollinger Bands on or off, while always highlighting the identified reversal candles.
How to Use
Configuration:
Set the desired SMA length and Bollinger Bands multiplier in the input settings.
Configure the ATR length for accurate stop-loss calculations.
Adjust the risk-reward ratio and take-profit line length according to your trading strategy.
Specify your account balance, leverage, and risk percentage for precise position sizing.
Chart Analysis:
Monitor the chart for candles touching the upper or lower Bollinger Bands. These highlights indicate potential overbought or oversold conditions.
Look for highlighted reversal candles, which meet the specified criteria and suggest a potential market reversal.
Use the plotted stop-loss and take-profit lines to manage your trades effectively. The combined labels provide all necessary information (SL, TP, nominal value, and cost value) for quick decision-making.
Execution and Risk Management:
Enter trades based on the reversal candle signals.
Set your stop-loss at the indicated level using the ATR calculation.
Take partial profits at the first take-profit level (1R) and adjust your stop-loss to the entry point to secure the remaining position.
Exit the trade entirely at the second take-profit level (2R) or if the price returns to the adjusted stop-loss level.
FVG Instantaneous Mitigation Signals [LuxAlgo]The FVG Instantaneous Mitigation Signals indicator detects and highlights "instantaneously" mitigated fair value gaps (FVG), that is FVGs that get mitigated one bar after their creation, returning signals upon mitigation.
Take profit/stop loss areas, as well as a trailing stop loss are also included to complement the signals.
🔶 USAGE
Instantaneous Fair Value Gap mitigation is a new concept introduced in this script and refers to the event of price mitigating a fair value gap one bar after its creation.
The resulting signal sentiment is opposite to the bias of the mitigated fair value gap. As such an instantaneously mitigated bearish FGV results in a bullish signal, while an instantaneously mitigated bullish FGV results in a bearish signal.
Fair value gap areas subject to instantaneous mitigation are highlighted alongside their average level, this level is extended until reached in a direction opposite to the FVG bias and can be used as a potential support/resistance level.
Users can filter out less volatile fair value gaps using the "FVG Width Filter" setting, with higher values highlighting more volatile fair value gaps subject to instantaneous mitigation.
🔹 TP/SL Areas
Users can enable take-profit/stop-loss areas. These are displayed upon a new signal formation, with an area starting from the mitigated FVG area average to this average plus/minus N ATRs, where N is determined by their respective multiplier settings.
Using a higher multiplier will return more distant areas from the price, requiring longer-term variations to be reached.
🔹 Trailing Stop Loss
A trailing-stop loss is included, increasing when the price makes a new higher high or lower low since the trailing has been set. Using a higher trailing stop multiplier will allow its initial position to be further away from the price, reducing its chances of being hit.
The trailing stop can be reset on "Every Signal", whether they are bullish or bearish, or only on an "Inverse Signal", which will reset the trailing when a signal of opposite bias is detected, this will preserve an existing trailing stop when a new signal of the same bias to the present one is detected.
🔶 DETAILS
Fair Value Gaps are ubiquitous to price action traders. These patterns arise when there exists a disparity between supply and demand. The action of price coming back and filling these imbalance areas is referred to as "mitigation" or "rebalancing".
"Instantaneous mitigation" refers to the event of price quickly mitigating a prior fair value gap, which in the case of this script is one bar after their creation. These events are indicative of a market more attentive to imbalances, and more willing to correct disparities in supply and demand.
If the market is particularly sensitive to imbalances correction then these can be excessively corrected, leading to further imbalances, highlighting a potential feedback process.
🔶 SETTINGS
FVG Width Filter: Filter out FVGs with thinner areas from returning a potential signal.
🔹 TP/SL
TP Area: Enable take-profit areas for new signals.
Multiplier: Control the distance from the take profit and the price, with higher values returning more distant TP's.
SL Area: Enable stop-loss areas for new signals.
Multiplier: Control the distance from the stop loss and the price, with higher values returning more distant SL's.
🔹 Trailing Stop
Reset Trailing Stop: Determines when the trailing stop is reset.
Multiplier: Controls the initial position of the trailing stop, with higher values returning more distant trailing stops.

Engulfing with Fibonacci LevelsIndicator Explanation
The indicator identifies bullish and bearish engulfing patterns and plots Fibonacci levels based on these patterns. Here's a detailed explanation of the script:
1. Bullish Engulfing Pattern
A bullish engulfing pattern is identified when:
- The previous candle is bearish (`close < open `).
- The current candle is bullish (`close > open`).
- The low of the current candle is lower than the low of the previous candle (`low < low `).
- The current candle's close is higher than the previous candle's open (`close > open `).
When a bullish engulfing pattern is identified:
- Fibonacci levels are plotted from the low (0%) to the high (100%) of the bullish candle.
- A green dot is plotted below the bullish candle to indicate a buy signal.
2. Bearish Engulfing Pattern
A bearish engulfing pattern is identified when:
- The previous candle is bullish (`close > open `).
- The current candle is bearish (`close < open`).
- The high of the current candle is higher than the high of the previous candle (`high > high `).
- The current candle's close is lower than the previous candle's open (`close < open `).
When a bearish engulfing pattern is identified:
- Fibonacci levels are plotted from the high (0%) to the low (100%) of the bearish candle.
- A red dot is plotted above the bearish candle to indicate a sell signal.
3. Plotting Fibonacci Levels
For both bullish and bearish patterns, Fibonacci levels are plotted at:
- 0% (high for bullish, low for bearish)
- 50%
- 61.8%
- 79%
- 100% (low for bullish, high for bearish)
Smart Money Concept (SMC) Explanation
Bearish Signal
In the context of Smart Money Concepts (SMC), a bearish engulfing pattern can indicate:
- **Buy Side Liquidity Grab**: The high of the current bearish candle goes above the high of the previous bullish candle, potentially grabbing buy-side liquidity (stop losses of short positions or buy stops).
- **Break of Structure (BoS)**: The close of the bearish candle below the open of the previous bullish candle indicates a shift in market structure.
After identifying this bearish engulfing pattern, a smart money trader might:
1. Wait for the market to retrace 50% of the bearish candle.
2. Enter a sell trade around the 50% retracement level, anticipating a continuation of the downward move.
#### Bullish Signal
Similarly, a bullish engulfing pattern can indicate:
- **Sell Side Liquidity Grab**: The low of the current bullish candle goes below the low of the previous bearish candle, potentially grabbing sell-side liquidity (stop losses of long positions or sell stops).
- **Break of Structure (BoS)**: The close of the bullish candle above the open of the previous bearish candle indicates a shift in market structure.
After identifying this bullish engulfing pattern, a smart money trader might:
1. Wait for the market to retrace 50% of the bullish candle.
2. Enter a buy trade around the 50% retracement level, anticipating a continuation of the upward move.
The indicator helps traders identify key engulfing patterns that align with smart money concepts of liquidity grabs and breaks of structure. By plotting Fibonacci levels, it visually aids traders in waiting for optimal retracement levels (50%) to enter trades in the direction of the anticipated move. This approach leverages the idea that significant market participants often seek liquidity and cause structural shifts, providing entry opportunities for informed traders.

CARNAC Trading Support and Resistance LevelsOverview
The "Carnac Trading Support and Resistance Levels" indicator is a powerful tool designed to help traders identify key support and resistance levels across multiple timeframes. This tool enhances trading strategies by visually marking significant price levels and providing configurable stop-loss and alert features.
Features
Support and Resistance Levels: Automatically calculates and plots support and resistance levels for the following timeframes:
5 minutes (5M)
10 minutes (10M)
15 minutes (15M)
30 minutes (30M)
1 hour (1H)
2 hours (2H)
4 hours (4H)
6 hours (6H)
12 hours (12H)
1 day (1D)
1 week (1W)
1 month (1M)
Configurable Stop-Loss (SL) Levels: Adds a stop-loss line below each support level and above each resistance level with customizable padding (as a percentage).
Visual Labels: Clearly labels support, resistance, and stop-loss levels with the corresponding prices and timeframes for easy identification.
Line Customization:
Support Levels: Green lines with varying thickness based on the timeframe.
Resistance Levels: Red lines with varying thickness based on the timeframe.
Stop-Loss Levels: Gray dotted lines for clear distinction.
Alerts: Alerts trigger when the price gets to a configurable percentage from the support or resistance levels, helping you stay informed about potential buying and selling opportunities.
Visibility Toggling: Easily toggle the visibility of support and resistance levels for each timeframe (default enabled for 2H, 4H, and 1D).
How to Use
Add the Indicator:
Navigate to the TradingView Pine Editor.
Paste the provided Pine Script code and click "Add to Chart."
Configure Inputs:
Lookback Periods: Adjust the lookback periods for each timeframe to suit your analysis needs.
Padding Percentage: Set the padding percentage for the stop-loss levels to define the distance below the support levels and above the resistance levels.
Visibility: Toggle the visibility of the support and resistance levels for each timeframe as needed (default enabled for 2H, 4H, and 1D).
Alert Trigger Distance: Set the alert trigger distance as a percentage to determine when the alerts should be triggered.
Interpret the Plotted Levels:
Green Lines: Indicate support levels for the respective timeframes.
Red Lines: Indicate resistance levels for the respective timeframes.
Gray Dotted Lines: Represent the stop-loss levels below each support level and above each resistance level, with the specified padding.
Labels: Provide clear indications of the price levels and their respective timeframes in white text for visibility.
Identifying Buying and Selling Opportunities:
Buying Opportunities:
Look for the price to approach or bounce off a support level (green line).
Confirm the potential for a reversal by checking if the price is nearing a key support level from multiple timeframes.
Use the stop-loss level (gray dotted line) to set your stop-loss order below the support level to minimize risk.
Selling Opportunities:
Look for the price to approach or get rejected at a resistance level (red line).
Confirm the potential for a reversal by checking if the price is nearing a key resistance level from multiple timeframes.
Use the stop-loss level (gray dotted line) to set your stop-loss order above the resistance level to minimize risk.
Alerts:
Alerts will notify you when the price gets within the specified percentage distance from each support or resistance level.
Use these alerts to stay informed about potential buying and selling opportunities.

Stop Hunts [MK]Liquidity rests above/below previous highs and lows because these are the areas where traders are most likely to leave their orders/stop losses. The market can tap into this liquidity source by going beyond the previous highs and lows, this liquidity can then be used to reverse the market in the opposite direction.
As traders we may want to know if price will continue beyond previous highs and lows, or reverse the market. If price looks to be reversing after tapping into liquidity, this can be a good area to enter a trade. The same area can be used as a take profit level also.
The indicator identifies previous high/lows in two ways:
1. previous high/lows using 'PIVOT POINTS'. Pivots are easy to spot and are obvious within a price trend. Also called 'higher highs", "lower lows" etc. The number of candles required to form the pivot point can be adjusted in the script settings.
see below example of pivot point and stop hunt:
www.tradingview.com
see how price reversed upwards after stop hunt on pivot point above.
2. previous candle high/lows. A previous candles high and low are also good areas of liquidity.
see below example of previous candle stop hunt:
see how price reversed upwards after stop hunt on previous candle low above.
Personally, I use the pivot point stop hunts on lower timeframes and previous candle stop hunts on higher timeframes. However users can adjust on which timeframes to show the indicator depending on their own trading style.
As ever all items within 'settings' are customizable.
The indicator is by no means a 'trading strategy' and users should be fully aware of the stop hunt concept and have conducted extensive back-testing before using with 'live' accounts.
The indicator may also serve as a 'teaching aid' to new students and as a reminder to more experienced traders.

Trade Exit Calculator [MarketSignalsPro]█ OVERVIEW
This Pine Script calculates a Stop Loss and Take Profit order suggestion based on the Average True Range (ATR). This provides a market generated visual reference for the user to better gauge risk and profit potential for their trades. This is not a trade signal system, it is a tool best used in conjunction with an existing system.
█ FEATURES
Inputs:
stopLossMultiplier and takeProfitMultiplier : These are input parameters that allow the user to adjust the multiplier for calculating stop loss and take profit levels.
longIndicator : This input parameter determines whether the script is calculating levels for a long setup (buy) or a short setup (sell).
Variable Initialization:
Various variables are initialized to manage labels, lines, and calculated stop loss and take profit levels.
ATR (Average True Range) is calculated using a period of 14.
Calculation of Stop Loss and Take Profit:
Depending on the value of longIndicator stop loss and take profit levels are not calculated the same way.
For long setups, stop loss is calculated below the closing price and take profit above, while for short setups, it's the opposite.
The calculation involves multiplying the ATR value by the user-defined multipliers and adding or subtracting from the closing price accordingly.
Plotting Lines:
Lines representing the calculated stop loss, take profit, and entry price are plotted on the chart.
Displaying Labels:
Labels displaying the calculated stop loss, take profit, and entry price are shown on the chart alongside the respective lines.
Updating and Deleting Objects:
Existing lines and labels are updated or deleted to ensure only the most recent levels are displayed on the chart.
Final Output:
The script outputs visual representations of stop loss, take profit, and entry price levels on the chart, providing traders with guidance for risk management and profit-taking strategies based on the volatility of the market.
█ CONCLUSION
In summary, this Pine Script enhances trading strategies by calculating and illustrating stop loss and take profit levels based on the Average True Range indicator, offering traders a structured way to manage risk and profit potential.
█ THANKS
Special thanks to Cryptosnagger for taking the time to build this Pine Script and share it freely with the community.

BlackPika Supertrend Public v2Hello Reader!
What is Supertrend indicator ?
The Supertrend Indicator is a popular technical analysis tool designed to assist traders in identifying market trends.
The indicator combines the average true range (ATR) with a multiplier to calculate its value. This value is then added to or subtracted from the asset’s closing price to plot the supertrend line.
The Supertrend Indicator can help identify trends, manage risk, and confirm market tendencies.
The indicator is limited by its lagging nature, is not very flexible, and can send up false signals.
The Supertrend Indicator has become a staple for traders in stocks, currencies, and commodities for its ability to identify and follow market trends.
About this script:
This script is based on the SuperTrend. There are some extra things added to make it able to use more efficiently. They are listed below:
1. Pullback signals: These signals indicate a pull back after a trend reversal and are the most optimum places where you can add to your existing position. They also come with Alerts !
2. Trailing Stop Loss and Take Profit: These further help to reduce the draw-down and can help you to trail profits with more granularity thus securing gains. This are using RSI levels. RSI levels above 70 will indicate a partial take profit when long and RSI levels below 25 will indicate a take profit level when short.
How to use ?
----------------
Personally I use it on major pairs on cryptocurrencies like BTCUSD . Usually after the trend flips, there will be pullbacks, You can enter a part of the position when trend reversal is confirmed. (LONG signal)
Then add more when you get a pullback (PB_LONG signal).
To make life simpler, alerts are added for pullback signals as well. These can help acheive good entry price. Entering at pullback signals limits your losses to a great extent, as the trend will flip on the bar close if it goes against you.
You can trade manually or you can automate. All the signals have been provided with Alerts. some signals have been grouped, to reduce the number of the alerts if you wish to.
I wish you all the luck and please comment and Like if you have any doubts.

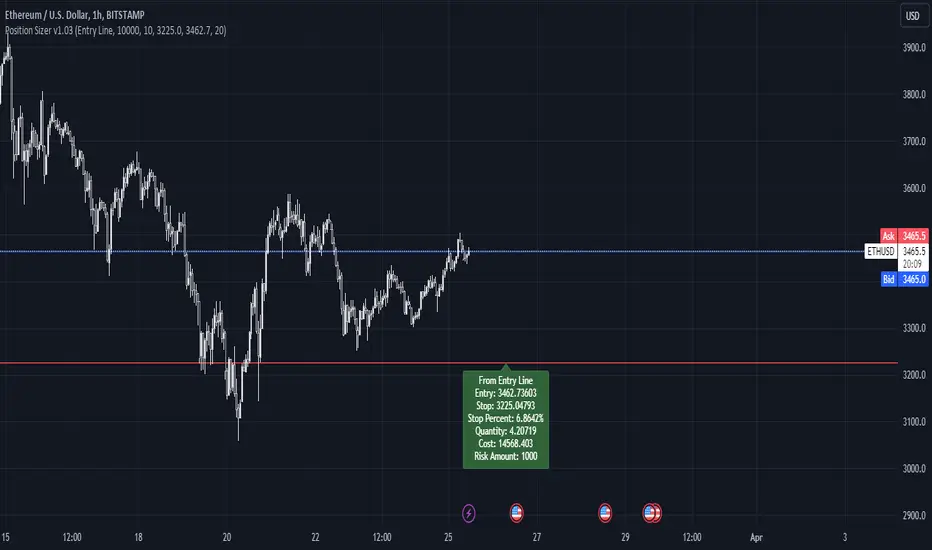
Simple Position SizerSimple Position Sizer is designed to calculate optimal position sizes based on a defined risk percentage and stop-loss level. It offers two modes for determining position size: using the current close price or a specified entry price. The script provides key trade details such as entry price, stop-loss level, quantity to trade, total cost, and risk amount in monetary terms, alongside visual indications of these parameters through colored lines and labels on the chart. Users can customize account size, risk per trade percentage, and entry and stop-loss levels directly within the settings.
Usage Scenario:
A trader looking to enter a position would first decide whether the entry is based on the current closing price or a predetermined level. After setting the stop-loss level and specifying the risk per trade as a percentage of the account size, the script calculates the number of shares or contracts to purchase. It also computes the total cost of the position and displays the potential loss if the stop-loss is triggered, allowing the trader to understand the risk involved before entering the trade.
Visual Indicators:
Green indicators suggest a long setup where the entry level is above the stop-loss, indicating bullish entry.
Red indicators signal a short setup where the entry level is below the stop-loss, reflecting bearish entry
Blue lines represent the entry level when specified by the trader, providing a visual cue for planned entries.
[S1B] Leverage Take-Profit-LinesShort Description:
The Leverage Take-Profit-Lines indicator assists traders in setting take-profit and stop-loss levels based on leverage, entry price, and risk percentage. It draws horizontal lines representing various take-profit levels and the stop-loss level on the chart, aiding traders in visually identifying potential exit points and managing risk.
Detailed Description:
The Leverage Take-Profit-Lines indicator is designed to provide traders with a visual representation of take-profit and stop-loss levels tailored to their leverage, entry price, and risk preferences.
Key Features:
Customizable Parameters: Traders can adjust parameters such as leverage, entry price, risk percentage, and whether to extend lines to suit their trading strategy.
Take-Profit Levels: The indicator calculates and draws horizontal lines representing different take-profit levels based on the specified percentage of leverage-adjusted entry price.
Stop-Loss Level: It calculates and displays the stop-loss level based on the specified risk percentage and leverage, helping traders manage risk effectively.
Visual Representation: The indicator visually highlights take-profit and stop-loss levels on the chart, facilitating quick decision-making for traders.
Usage Guide:
Setting Parameters: Adjust the input parameters including leverage, entry price, risk percentage, and other settings according to your trading strategy.
Interpreting Lines: Horizontal lines are drawn on the chart representing take-profit levels (TP1, TP2, TP3, TP4) and the stop-loss level. These lines indicate potential exit points and risk management levels.
As an example the TP1 can be used to sell 10% of position size, TP2 20%, TP3 20% and TP4 20-40%.
The Leverage Take-Profit-Lines indicator empowers traders with valuable insights into setting profit targets and managing risk effectively, contributing to more informed trading decisions.
Trend Signals with TP & SL [UAlgo]The "Trend Signals with TP & SL " indicator is a versatile tool designed to assist traders in identifying potential trend continuation opportunities within financial markets Utilizing a combination of technical indicators and user-defined parameters, this indicator aims to provide clear and actionable signals to aid traders in making informed trading decisions.
🔶 Features:
Trend Continuation Signals : The indicator generates signals to identify potential trend continuation points based on the input parameters such as sensitivity, ATR length, and cloud moving average length.
Take-Profit and Stop-Loss Levels: It calculates and plots three levels of take-profit (1R, 2R, 3R) and stop-loss levels based on the entry price of the trade.
Short Position Example:
Long Position Example:
Visualization: The script visualizes the trend signals, entry points, take-profit levels, and stop-loss levels on the price chart, making it easier for traders to interpret the signals.
Alert System: The indicator includes an alert system that notifies the user when there is a change in trend direction or when a buy/sell signal is generated. The alerts provide essential information such as entry price, take-profit levels, and stop-loss levels.
🔶 Calculations :
Trend Calculation: Trend signals are determined based on the comparison between the current closing price and the upper and lower bounds calculated using the Average True Range (ATR) multiplied by a sensitivity factor. A trend is considered bullish if the closing price is above the upper bound and bearish if it's below the lower bound.
Entry, Stop Loss, and Take Profit Calculation: Entry points for long and short positions are identified when there's a change in trend direction.
Stop-loss levels are calculated as a percentage of the entry price, where users can define the percentage based on their risk tolerance.
Take-profit levels are calculated as multiples of the stop-loss level (1R, 2R, 3R).
Cloud Moving Averages: Simple moving averages (SMAs) are calculated for high and low prices over a specified period to create a "cloud" visualization on the chart.
MACD Clouds: Moving Average Convergence Divergence (MACD) indicator is used to determine the market's momentum and trend direction. Positive and negative clouds are plotted based on the MACD line and its signal line, indicating potential bullish or bearish trends.
Signal Generation: Buy and sell signals are generated based on specific conditions such as RSI, CMO (Chande Momentum Oscillator), and pivot points.
Signals are triggered when certain criteria are met, indicating potential opportunities for entering or exiting trades.
🔶 Disclaimer:
Use at Your Own Risk: Trading involves significant risk, and this script is provided for educational and informational purposes only. It does not guarantee profitable trades, and users should exercise caution and perform their own analysis before making trading decisions.
Parameter Sensitivity: The effectiveness of the indicator may vary depending on the chosen parameters, market conditions, and timeframe. Users are encouraged to backtest the script thoroughly and adjust the parameters according to their trading preferences.
Not Financial Advice: The information provided by this script should not be considered as financial advice. Users are solely responsible for their trading decisions and should consult with a qualified financial advisor if needed.
Backtesting and Validation: Before implementing this indicator in live trading, users are strongly encouraged to conduct rigorous backtesting and validation to assess its performance under various market conditions. Past performance is not indicative of future results, and users should carefully evaluate the effectiveness of the indicator based on their individual trading preferences and risk tolerance.

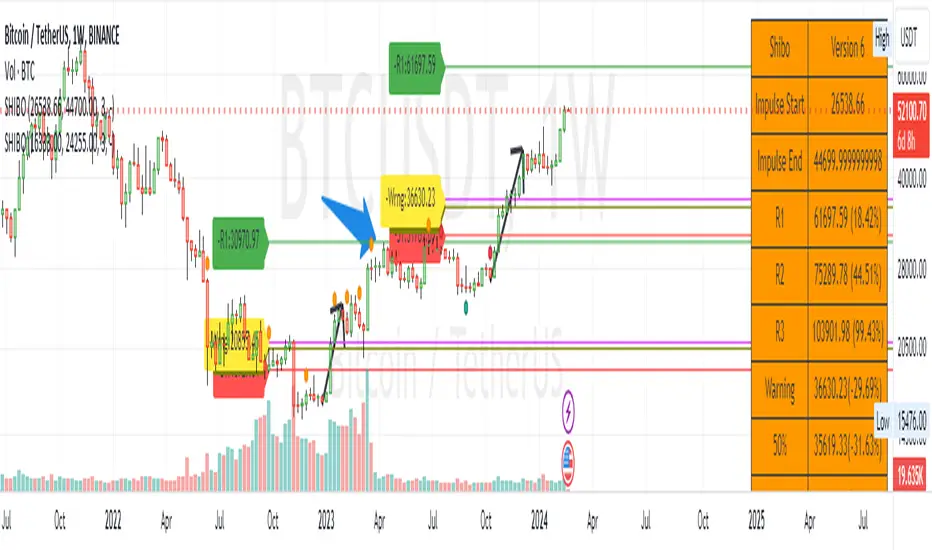
SHIBO V6.0**SHIBO v6 - Fibonacci Impulse Analysis Indicator**
*By Shahab Sadeghi (@shahabs2004)*
**Overview:**
Welcome to SHIBO v6, a revolutionary Fibonacci Impulse Analysis Indicator designed to harness the power of a unique chart pattern. The script employs a reverse Fibonacci methodology to identify powerful impulses that first reach Fibonacci level 0.382, experience a correction, and then continue toward Fibonacci level 1. This description delves into the intricacies of how the script calculates precise price targets based on this distinctive pattern.
keep in mind that this Indicator is based on this Idea that each Impulse have its own support and Resistant Levels(stop loss and Target)
**Key Features:**
1. **Reverse Fibonacci Calculation:** SHIBO v6 introduces a novel approach to Fibonacci analysis. Instead of the conventional method where price targets are set from Fibonacci 0 to 1, this script calculates the distance price moves towards Fibonacci 1 from 0.382. This innovative technique identifies potential reversal and continuation zones with unparalleled accuracy.
2. **Impulse and Correction Identification:** Users play a pivotal role in recognizing high-probability trading opportunities. The script requires manual selection and marking of powerful impulses, focusing on identifying corrections and anticipating potential reversal zones within these impulses.
3. **Optimized Fibonacci Levels:** Leveraging the reverse Fibonacci approach, the script dynamically computes and draws Fibonacci retracement levels (R1, R2, R3) based on the calculated distance the price has moved towards Fibonacci 1. These levels serve as strategic benchmarks, offering insights into potential price movements and areas of interest.
4. **Dynamic Line Drawings:** SHIBO v6 features dynamic line drawings, including impulse start and end points, Fibonacci levels, and stop-loss levels. These visual elements facilitate a comprehensive understanding of the analysis, assisting users in making well-informed trading decisions.
5. **Informative Table Display:** A dedicated table provides crucial information, including impulse start and end points, Fibonacci levels, and percentage deviations from the current price. This table enhances the user's grasp of the analyzed data, fostering effective decision-making.
6. **Prefix Identification:** Users employing multiple SHIBO indicators on a chart can use the Prefix input to assign a unique identifier to each instance. This streamlines the analysis process, particularly when dealing with multiple instances of the indicator.
**How the Script Calculates Targets:**
1. **Impulse Recognition:** Users manually identify a robust impulse in the price movement, signifying a potential trend change or continuation.
2. **Correction Confirmation:** Anticipate or confirm the start of a correction phase within the selected impulse. Corrections often occur after a strong price movement.
3. **Manual Setting of IS and IE Points:** Set the impulse start (IS) and end (IE) points manually based on the identified impulse and correction.
4. **Fibonacci Level Calculation:** The script dynamically calculates Fibonacci levels (R1, R2, R3) based on the distance the price has moved towards Fibonacci 1 from 0.382. These levels serve as potential targets and areas of interest.
5. **Visual Representation:** The script visually represents the calculated levels through dynamic line drawings, providing a clear picture of potential reversal and continuation zones.
**Advanced Usage (Pro Users):**
- **Customizable Line Drawings:** Explore the commented-out lines in the script for additional functionalities and customization options for line drawings. Pro users can tailor the script to align with unique trading strategies.
**Disclaimer:**
Trading carries inherent risks, and SHIBO v6 introduces a distinctive approach to technical analysis. Exercise caution, conduct thorough analysis, and consider risk management strategies before making trading decisions. Past performance does not guarantee future results.
**Support and Feedback:**
Join the community of traders committed to refining strategies based on reverse Fibonacci impulse analysis. Share your experiences, insights, and suggestions to contribute to the continuous improvement of SHIBO v6.
**how Calculations Goes ?**
Imagine you're analyzing a stock price:
IS (Initial Start Price): Let's say the stock price starts at $100.
IE (Initial End Price): After a significant movement, the price reaches $120.
1. Identify Fibonacci Retracement Levels:
fi1 (0.382): This level suggests a potential retracement of 38.2% of the upward move.
fi2 (0.5000): This level represents a 50% retracement, or halfway back to the starting price.
fi3 (0.6180): This level represents the "Golden Ratio" and another potential support/resistance area.
fi4 (0.7860): This level suggests a retracement of 78.6% and can also be used for stop-loss calculations.
2. Calculate Multiples:
m1: Divide the final price ($120) by the starting price ($100) raised to the power of fi1 (120 / 100^0.382). This gives you a value we'll use later.
m2: Similar calculation, but using fi2 instead of fi1.
m3: Similar calculation, but using fi3 instead of fi1.
3. Calculate Target Prices:
Take Profit (Resistance)
TP1: Raise the value of m1 to the power of 1/(1-fi1). This gives you a potential upside target price based on the 38.2% retracement level.
TP2: Similar calculation, but using m2 and fi2.
TP3: Similar calculation, but using m3 and fi3.
4. Calculate Stop-Loss Levels:
Stop loss(Support)
SL1 or Support: Multiply TP1 by the starting price ($100) raised to the power of fi4. This gives you a potential downside stop-loss level based on the 78.6% retracement from TP1.
SL2: Similar calculation, but using TP2 and fi4.
SL3: Similar calculation, but using TP3 and fi4.
5. Calculate Midpoint Level:
MID: Multiply TP1 by the starting price ($100) raised to the power of fi3. This gives you a potential support/resistance level halfway between TP1 and the starting price.
Remember, these are just potential levels and not guaranteed. It's important to use other technical and fundamental analysis alongside Fibonacci retracements.
Here's the breakdown of the steps and their results:
1. Fibonacci levels define potential support and resistance areas:
The chosen Fibonacci levels (0.382, 0.5, 0.618, and 0.786) are often seen as potential zones where the price might stall or reverse after a strong move.
2. Multiples and target prices:
The multiples (m1, m2, m3) represent price ratios based on different retracement levels.
Target prices (TP1, TP2, TP3) are calculated by raising these multiples to specific exponents. These prices suggest areas where the price might encounter resistance after a retracement (not guaranteed predictions).
3. Stop-loss levels:
Stop-loss levels (SL1, SL2, SL3) are based on the target prices and another Fibonacci level (0.786). They mark price points where a trader might exit a trade to manage risk if the price moves against them.
Essentially, the calculations translate Fibonacci retracement levels into concrete price points for potential entry (targets) and exit (stop-loss) points.
*Happy Trading and Empowered Analysis!*
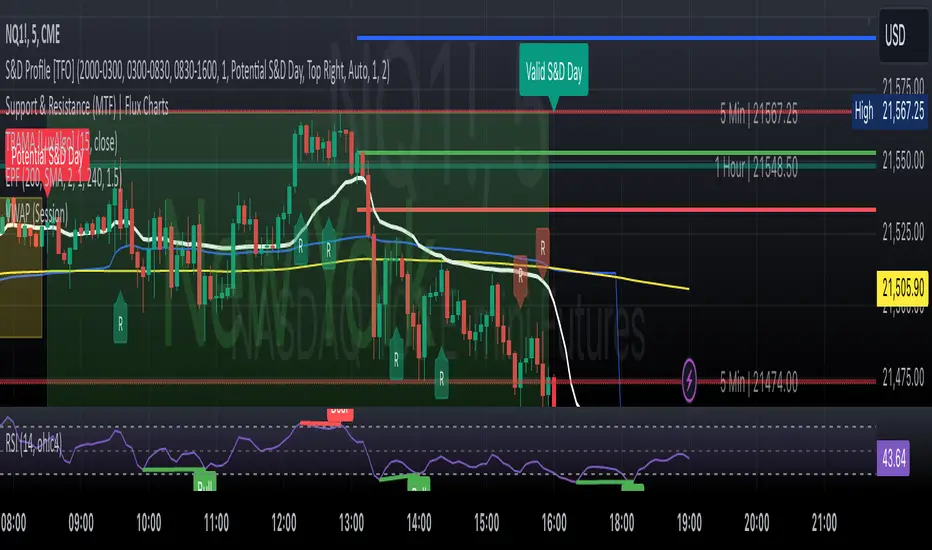
ORB Algo | Flux Charts💎 GENERAL OVERVIEW
Introducing our new ORB Algo indicator! ORB stands for "Opening Range Breakout" which is a common trading strategy. The indicator can analyze the market trend in the current session and give "Buy / Sell", "Take Profit" and "Stop Loss" signals. For more information about the analyzing process of the indicator, you can read "How Does It Work ?" section of the description.
Features of the new ORB Algo indicator :
Buy & Sell Signals
Up To 3 Take Profit Signals
Stop-Loss Signals
Alerts for Buy / Sell, Take-Profit and Stop-Loss
Customizable Algoritm
Session Dashboard
Backtesting Dashboard
📌 HOW DOES IT WORK ?
This indicator works best in 1-minute timeframe. The idea is that the trend of the current session can be forecasted by analyzing the market for a while after the session starts. However, each market has it's own dynamics and the algorithm will need fine-tuning to get the best performance possible. So, we've implemented a "Backtesting Dashboard" that shows the past performance of the algorithm in the current ticker with your current settings. Always keep in mind that past performance does not guarantee future results.
Here are the steps of the algorithm explained briefly :
1. The algorithm follows and analyzes the first 30 minutes (can be adjusted) of the session.
2. Then, algorithm checks for breakouts of the opening range's high or low.
3. If a breakout happens in a bullish or a bearish direction, the algorithm will now check for retests of the breakout. Depending on the sensitivity setting, there must be 0 / 1 / 2 / 3 failed retests for the breakout to be considered as reliable.
4. If the breakout is reliable, the algorithm will give an entry signal.
5. After the position entry, algorithm will now wait for Take-Profit or Stop-Loss zones and signal if any of them occur.
If you wonder how does the indicator find Take-Profit & Stop-Loss zones, you can check the "Settings" section of the description.
🚩UNIQUENESS
While there are indicators that show the opening range of the session, they come short with features like indicating breakouts, entries, and Take-Profit & Stop-Loss zones. We are also aware of that different stock markets have different dynamics, and tuning the algorithm for different markets is really important for better results, so we decided to make the algorithm fully customizable. Besides all that, our indicator contains a detailed backtesting dashboard, so you can see past performance of the algorithm in the current ticker. While past performance does not yield any guarantee for future results, we believe that a backtesting dashboard is necessary for tuning the algorithm. Another strength of this indicator is that there are multiple options for detection of Take-Profit and Stop-Loss zones, which the trader can select one of their liking.
⚙️SETTINGS
Keep in mind that best chart timeframe for this indicator to work is the 1-minute timeframe.
TP = Take-Profit
SL = Stop-Loss
EMA = Exponential Moving Average
OR = Opening Range
ATR = Average True Range
1. Algorithm
ORB Timeframe -> This setting determines the timeframe that the algorithm will analyze the market after a new session begins before giving any signals. It's important to experiment with this setting and find the best option that suits the current ticker for the best performance. More volatile stocks will often require this setting to be larger, while more stabilized stocks may have this setting shorter.
Sensitivity -> This setting determines how much failed retests are needed to take a position entry. Higher senstivity means that less retests are needed to consider the breakout as reliable. If you think that the current ticker makes strong movements in a bullish & bearish direction after a breakout, you should set this setting higher. If you think the opposite, meaning that the ticker does not decide the trend right after a breakout, this setting show be lower.
(High = 0 Retests, Medium = 1 Retest, Low = 2 Retests, Lowest = 3 Retests)
Breakout Condition -> The condition for the algorithm to detect breakouts.
Close = Bar needs to close higher than the OR High Line in a bullish breakout, or lower than the OR Low Line in a bearish breakout. EMA = The EMA of the bar must be higher / lower than OR Lines instead of the close price.
TP Method -> The method for the algorithm to use when determining TP zones.
Dynamic = This TP method essentially tries to find the bar that price starts declining the current trend and going to the other direction, and puts a TP zone there. To achieve this, it uses an EMA line, and when the close price of a bar crosses the EMA line, It's a TP spot.
ATR = In this TP method, instead of a dynamic approach the TP zones are pre-determined using the ATR of the entry bar. This option is generally for traders who just want to know their TP spots beforehand while trading. Selecting this option will also show TP zones at the ORB Dashboard.
"Dynamic" option generally performs better, while the "ATR" method is safer to use.
EMA Length -> This setting determines the length of the EMA line used in "Dynamic TP method" and "EMA Breakout Condition". This is completely up to the trader's choice, though the default option should generally perform well. You might want to experiment with this setting and find the optimal length for the current ticker.
Stop-Loss -> Algorithm will place the Stop-Loss zone using setting.
Safer = The SL zone will be placed closer to the OR High for a bullish entry, and closer to the OR Low for a bearish entry.
Balanced = The SL zone will be placed in the center of OR High & OR Low
Risky = The SL zone will be placed closer to the OR Low for a bullish entry, and closer to the OR High for a bearish entry.
Adaptive SL -> This option only takes effect if the first TP zone is hit.
Enabled = After the 1st TP zone is hit, the SL zone will be moved to the entry price, essentially making the position risk-free.
Disabled = The SL zone will never change.
2. ORB Dashboard
ORB Dashboard shows the information about the current session.
3. ORB Backtesting
ORB Backtesting Dashboard allows you to see past performance of the algorithm in the current ticker with current settings.
Total amount of days that can be backtested depends on your TV subscription.
Backtesting Exit Ratios -> You can select how much of percent your entry will be closed at any TP zone while backtesting. For example, %90, %5, %5 means that %90 of the position will be closed at the first TP zone, %5 of it will be closed at the 2nd TP zone, and %5 of it will be closed at the last TP zone.

Liquidation Levels [LuxAlgo]The Liquidation Levels indicator aims at detecting and estimating potential price levels where large liquidation events may occur.
By analyzing liquidation Levels, traders can identify potential support & resistance levels, identify stop-loss levels, and gauge market sentiment and potential areas of price volatility.
🔶 USAGE
Liquidation refers to the process of forcibly closing a trader's leveraged positions in the market. It occurs when a trader's margin account can no longer support their open positions due to significant losses or a lack of sufficient margin to meet the maintenance margin requirements.
Liquidation events happen at all times and the script focuses on detecting the most significant ones. Bubbles will appear on the relevant price bar when larger trading activity has been detected. Larger bubbles represent more significant potential liquidation levels. The lines attached to the bubbles represent the liquidation zones at that price.
These liquidation levels are based on clusters of price points where highly leveraged traders open long or short positions. High leverage is identified as 100x, 50x, and 25x leverages used for both long and short positions. The script allows users to either remove or customize leverage levels.
Price generally heads towards zones or clusters of liquidity.
🔶 SETTINGS
🔹Liquidation Levels
Reference Price: defines the base price in calculating liquidation levels.
Volume Threshold: The volume threshold is the primary factor in detecting the significant trading activities that could potentially lead to liquidating leveraged positions.
Volatility Threshold: The volatility threshold option is the secondary factor that aims at detecting significant movement in the underlying asset’s price with relatively lower trading activities that could potentially also lead to liquidating high-leveraged positions.
Leverage Options: The leverage options are where the trader will set the desired leverage value and customize the potential liquidation level colors.
Hide Liquidation Bubbles: Toggles the visibility of the bubbles.
Hide Liquidation Levels: Toggles the visibility of the lines.
🔶 RELATED SCRIPTS
Liquidity-Sentiment-Profile
Buyside-Sellside-Liquidity

Auto Trailing stoploss By InvestYourAsset💥The Auto Trailing Stop-Loss indicator is a technical indicator that uses the ATR (Average True Range) to calculate a trailing stop-loss for both long and short positions.
💥The signals according to the indicator allows traders to exit from the position before its too late! The indicator can be used to determine when to enter and exit trades.
💥To use the indicator, you simply need to set the input parameters to suit your trading style and risk tolerance. The default values for the parameters are:
p: The ATR period (14)
q: The stop period (20)
x: The multiplier used to calculate the initial high and initial low (1.5)
Calculations:
📈Calculates the ATR using the specified period you can modify ATR period according to your trading style.
📈Calculates the initial high and low stop levels based on the highest high and lowest low over the user defined ATR period.
📈Calculates short and long stoploss levels using the initial high and low stops.
💥Once you have set the input parameters according to your trading style whether you are a day trader or a swing trader, the indicator will plot the short stoploss, long stoploss, and stoploss hit signals on your chart.
💥You can use the indicator to enter and exit trades in a various ways.
For example,
🚀 you could enter a long trade when the price crosses above both red and green lines plotted on the chart. (or when price crosses over both short stoploss and long stoploss.) You could also use the indicator to secure your profits by moving your stop-loss up as the price moves in your favor.
Here is an example of how you could use the indicator to enter and exit trades:
🚀Enter a long trade when the price crosses above the red line or short stoploss.
✅keep Moving your stop-loss upward with the long stoploss or green line.
✅Exit the trade when the price crosses below the long stoploss or green line.
💥You can also use the indicator to protect your existing trades. For example, if you are already in a long trade, you could move your stop-loss up to the short stop when the price moves up 10%. This will help you to protect your profits in case the price starts to move against you.
💥💥some additional tips for using the Auto Trailing Stop-Loss indicator:
✅Use the indicator in conjunction with other technical indicators or your own trading strategy to generate entry and exit signals.
✅Backtest your trading strategy before using it live to make sure that it is profitable.
✅Use the indicator to protect your profits by moving your stop-loss up as the price moves in your favor.
✅ Always follow risk management rules and manage your position sizing according to your risk appetite.
✅ Be aware of the overall trend direction. If the trend is up, you should be looking for bullish reversals or continuations. If the trend is down, you should be looking for bearish reversals or continuations.
This script essentially provides a visual representation of a trading strategy that automatically adjusts stop-loss levels based on market volatility (ATR). It also includes signals for entering long or short positions and visually highlights these signals on the chart.
📣📣Follow us for timely updates regarding future indicators and give it a like if you appreciate the work.📣📣
